Sliced Bars or Imperfect Stars? How to Shape Consumer Preferences with Your Product Rating Design
Relevant topics Archive, Strategy
Ever wondered what is actually shaping your product preferences? Before you click that "Add to Cart" button, what if I told you that the aesthetics of product ratings is subtly guiding your choices?
In a world flooded with product options, the battle for consumer attention extends beyond any tangible features. It’s about that first glance, the initial impression, and the power of other people’s opinion. Since 1999, we can trace the beginning of online reviews and shopping has never been the same.
We know the influential power of product ratings on buying decisions (De Langhe et al., 2016). The exploration of the aesthetics of product ratings in a recent study uncovers a more profound impact which transcends the mere numerical values assigned to products and services.
Seven experiments and twenty-three supplementary studies with a total sample of over 17,000 respondents revealed how the shape of basic visual rating units, commonly present on websites, has the ability to define buyers’ preferences. A mental process involving visual completeness restoration with a subsequent visual rounding effect takes place when evaluating online ratings. In marketing practice, basic rating units are vertically divided into a cutout area and a retained area to indicate a decimal rating. When a rating is below the nearest digit (e.g., 3.8 out of 5), the retained area of the basic rating unit representing the decimal value appears to be incomplete after vertical cutting (Fig. 1).
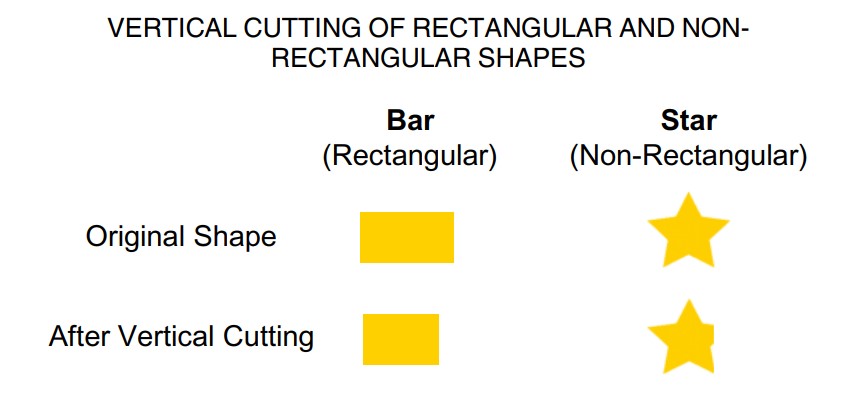
Fig 1. Vertical cutting of rectangular and non-rectangular shapes (as used by Jia et al., 2023)
There are actionable insights that, as marketer, you can take onboard based on the ideal visual rating format. Strategies can also be implemented to prevent the visual rounding effect from happening, and identifying the type of consumer most susceptible to this visual phenomenon. The overall aesthetics of product ratings on your website (like shape and color) are now proven to be a useful tool in a marketer’s arsenal not to be overlooked. So let’s dive in!
Shaping Preferences: The Impact of Rectangular vs. Non-Rectangular Rating Units
As the digital marketplace continues to evolve, online ratings are being displayed in various formats. The goal is to achieve visual influence and ultimately, have authority over product choice.
In visual marketing, the most common formats for rating units are rectangular and non-rectangular (mainly bar and star ratings, as the most popular representations used across websites).
It turns out, when faced with product ratings not expressed by a whole number, and rather by a digit with exact decimals, consumers will make different choices based on the shape of the rating unit. Non-rectangular formats, like stars, have a magnetic pull when numbers are below the nearest digit (or integer). When rating values are above the nearest digit, rectangular formats take the lead.
Picture this: a product or service with a rating of 3.8, sitting just below its nearest digit, in this case 4. The consumer appeal has been shown to be 40% higher when the rating has a star shape (Jia et al., 2023). Flip the scenario to a rating of 4.2, which sits above the nearest digit 4, and bars get center stage while stars lose their charm.
Why is this happening? The explanation lies in the mental process of visual completeness restoration with a subsequent visual rounding effect (Fig. 2).
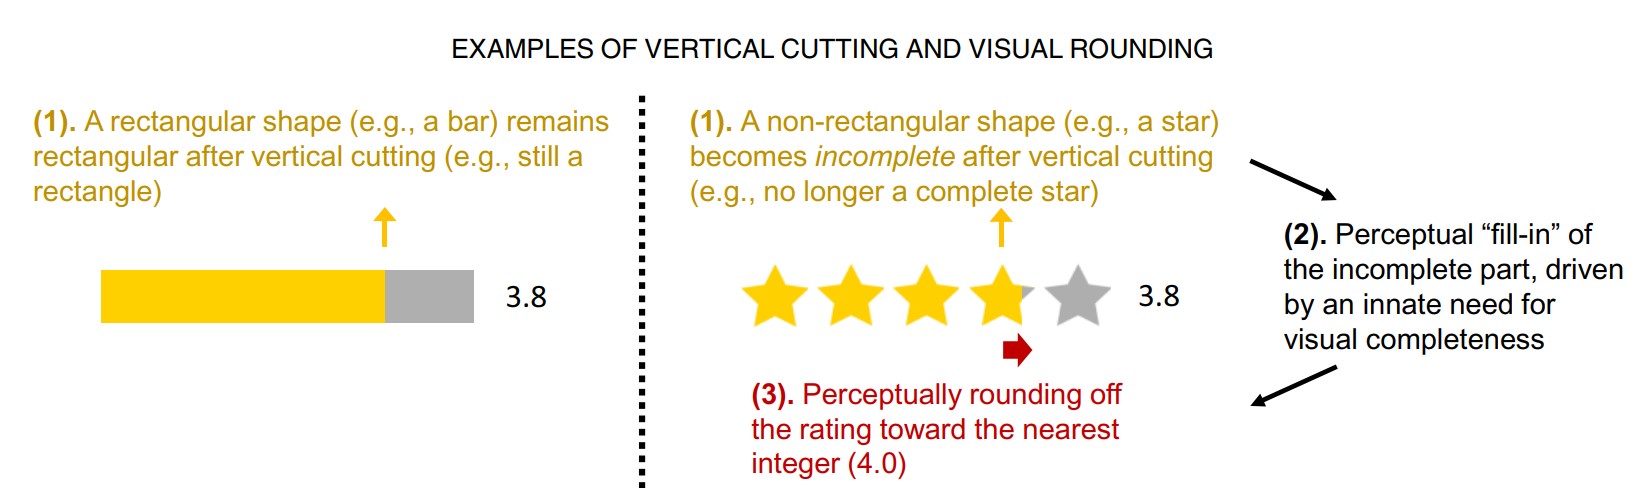
Fig. 2. Vertical cutting and visual rounding (as used by Jia et al., 2023)
The Visual Rounding Effect over Buying Decisions
When representing a rating with decimals (3.1, 4.5, 4.8 etc.), the shape used must be vertically cut to demonstrate its particular decimal value. Not really a problem with a rectangle: after slicing it, a rectangle is still a rectangle. But non-rectangular shapes (such as stars) are perceived as incomplete after a vertical cut. The very shape that initially attracted our attention now becomes a source of cognitive dissonance (or; mental discomfort).
For example, when a star is vertically cut, consumers tend to mentally restore the missing part, leading to a rounding of decimal ratings. It can be a rounding-up or rounding-down effect showcasing a meticulous interplay between visual format, rating position, and consumer perception. Understanding this mental process presents the opportunity to not only observe but strategically present ratings on your website for optimal impact (Fig. 3).
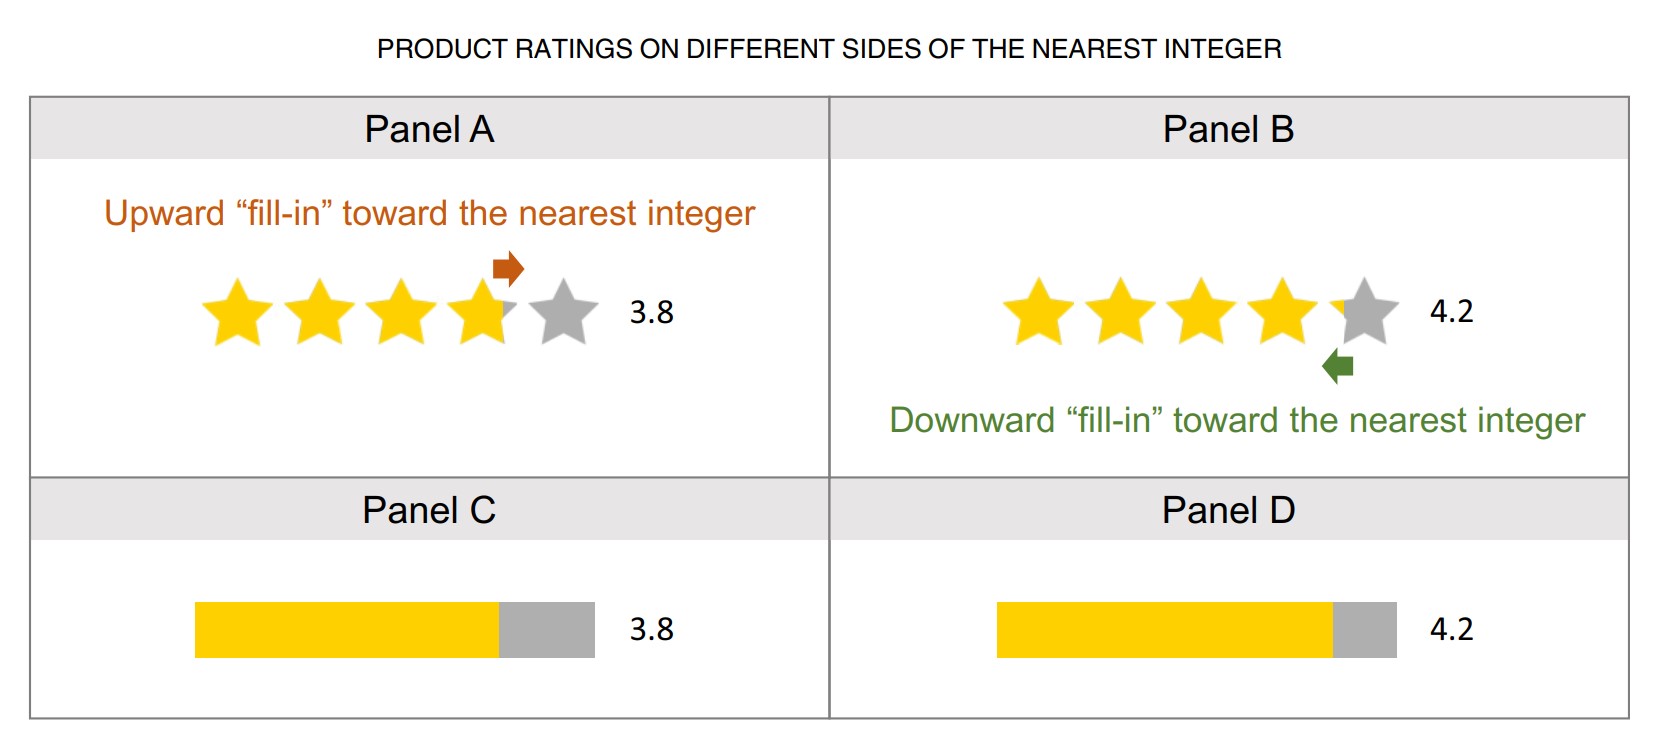
Fig. 3. Product ratings on different sides of the nearest integer (digit) (as used by Jia et al., 2023)
The rounding-up effect happens naturally in our brains as a consequence of our innate need to process visual cues as a whole. We automatically fill in the gaps and construct a holistic view of all the elements presented, even if some are incomplete or missing, based instead on their interrelations. This is called the Gestalt level of perception. The process extends not only to object borders but also to visual gaps that we tend to fill in with surrounding color or texture (Anstis, 2010; von der Heydt et al., 2003).
The visual rounding effect works not only on overall ratings, but also on ratings based on individual product features (by-attribute rating) (Fig. 4). It’s a complex buyer decision-making context with a large scope for future research into different product categories and configurations.
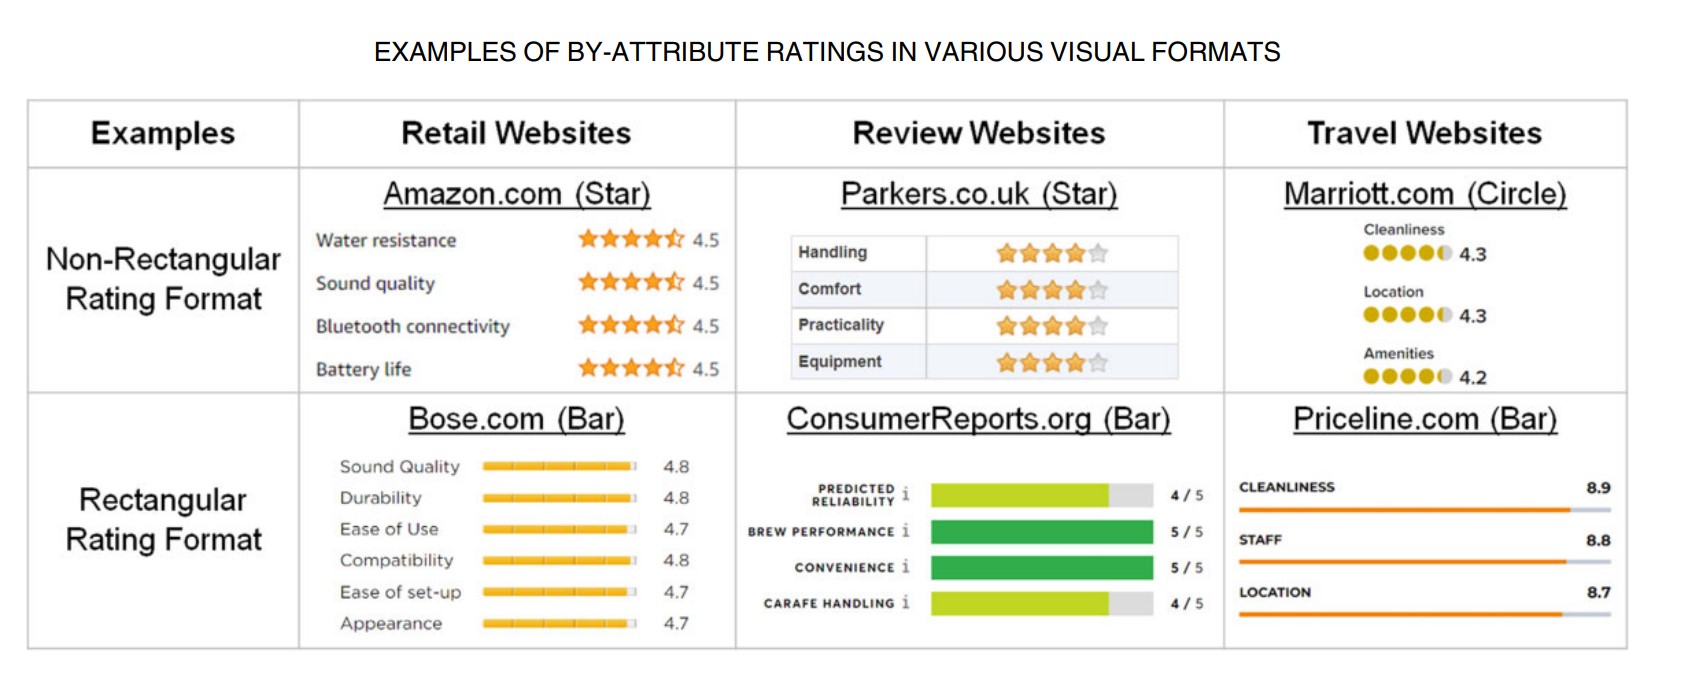
Fig. 4. By-attribute ratings in various visual formats (as used by Jia et al., 2023)
What does this psychological impact of visual aesthetics on consumer preferences mean for you, as a marketer? How can you leverage it to sway consumer choice?
Managerial Implications of The Aesthetics of Product Ratings ‘Shape”
This new research challenges common practices in visual rating formats, particularly for overall product ratings. As a manufacturer, retailer or service provider, actionable insights can be strategically undertaken using the new insights.
1. Choose the right format based on rating distribution
Non-rectangular rating formats increase product preference when ratings are below the nearest digit. For ecommerce stores, e.g., where products often employ decimals below the nearest digit, non-rectangular formats are ideal – stars and not bars may just align with consumer preferences.
Bose, for example, with a high reputation as a speaker brand, could undertake a switch of tactics from their current bar rating format by product attributes to a non-rectangular rating visual (e.g., stars). This is recommended since the majority of their products are rated 4.7, 4.8 and 4.9, below the nearest digit (5.0). The result would be a potential increase in favorable consumer response, by perceiving all ratings to be a perfect 5.
2. Adapt to different scenarios
Non-rectangular rating formats decrease product preference when ratings are above the nearest digit. When your products are mainly reviewed above the nearest scoring digit, bars and other rectangular formats might be just what you need. Take JBL, another major player in the audio speaker market, who uses star ratings on its website. Their products are mainly rated above the nearest digit (4.1, 4.2, 4.3). They could benefit from a rectangular format instead (e.g., bar or square) to mitigate the visual rounding-down effect and improve positive impressions.
3. Mitigate the visual rounding effect through separation
To tackle the visual rounding effect which may negatively impact product choice, you could deliberately highlight a visual separation between the cutout and retained areas. This in turn will reduce perceived wholeness, diminishing the rounding up or down effect.
4. Act on the perceived wholeness for desired product choice
The visual rounding effect can be attenuated when the complete shape of a rating unit is retained. Instead of slicing the stars, which can distort perception, try using smaller stars. It’s still a precise presentation of decimals but without giving that uncomfortable feeling of something missing.
Animating the visual representation of the rating scale also demonstrates a lot of potential in achieving the same result. Using two or more colours that fade into the boundary area can actually have a similar outcome - highlighting visual separation and reducing the visual rounding effect (Fig. 5).
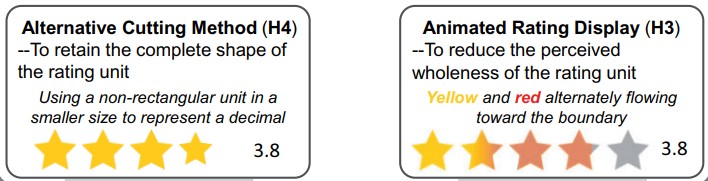
Fig. 5. Removing the trigger or turning off the process of visual completeness restoration (as used by Jia et al., 2023)
5. Understand consumer differences affecting the process
The visual rounding effect is stronger with consumers with a higher tendency toward holistic/Gestalt processing. Age has been identified as a proxy for the innate need for visual completeness (Brandtstadter & Greve, 1994), with the effect becoming stronger as we grow older.
As the tendency toward holistic/Gestalt processing increases, so does the visual rounding effect. When it comes to managing visual rating formats, not all consumers perceive information in the same way. Holistic thinkers, like those in Asians or Hispanics cultures, are more susceptible (Lalwani & Shavitt, 2013).
Marketers are encouraged to carefully optimise their visuals to sway buyers’ minds, ensuring they align with the distribution of their product ratings and resonate effectively with diverse market segments. The era of digital commerce demands not only numerical accuracy, but also a grasp of the visual subtleties influencing buyers’ purchase decisions.
